


The following post provide an overview of the steps required to complete the three stages and are presented in a format for conducting a se...
The following post provide an overview of the steps required to complete the three stages and are presented in a format for conducting a segmentation project using internal resources.
A clear geographic boundary enables you to size the market, to identify the localities in which the dynamics of the market have to be understood and, once the segments have been identified, to develop the appropriate marketing objectives and strategies for those localities.


The uniqueness of a micro-segment is that, when determining which of the alternative offers is to be bought, the decision makers it represents demonstrate a similar level of interest in a specific set of features, with the features being the characteristics and properties of what is bought, where it is bought, when it is bought and how it is bought as appropriate to the micro-segment. To this are added the descriptors that describe who the micro-segment represents, along with an estimate of the volume or value they account for in the defined market.


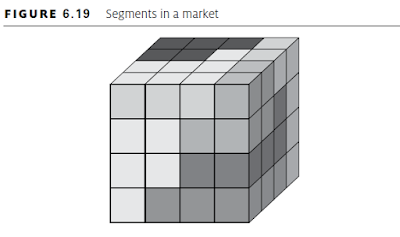

Table 6.3 is a summary of what we have discussed so far. Once market segmentation has been carried out, positioning products and services to meet the different needs of the different segments is comparatively straightforward, but not easy. The most intellectually challenging task is segmenting markets. It is also vital to focus on serving the needs of the identified segments, while it is dangerous to straddle different segments with the same offer. The photocopier example was only one example of thousands of well-known companies that suffered from this mistake as markets began to break into segments. The computer industry during the 1980s and 1990s was also replete with examples of this mistake.

An internal GlobalTech team tried to complete a marketing audit early in 2000. This included
market definition, market segmentation and quantification. The product divisions conducted
their audits separately. They used mainly brainstorming techniques to define their markets
and produce the data required.
Similarly, the segments each division identified were in conflict with the outputs from the other divisions. On reflection, it was agreed that the results were unreliable. They could not be used to help shape future strategies or marketing investments. GlobalTech was now in the uncomfortable situation of being in a market information vacuum. Any confidence it had had in its understanding of the market had been destroyed. Consequently, the decision was taken that all future market analysis and understanding tasks would be supported by appropriate investments in market research.
The qualitative study produced a very clear picture and definition of the markets addressed by GlobalTech. It also provided the customers’ view of the benefits they sought from the products and the differences in their attitudes towards their suppliers. The questionnaire for the quantitative study was based on the results of the qualitative study. The result was seven clearly defined product buyer segments.
For many years, product churns and upgrades from existing customers had accounted for some 70 per cent of GlobalTech’s product revenues. Service and exhaust revenues almost equalled total product revenues. (Exhaust revenues are those revenues that follow on, almost automatically, from an initial product sale. These would normally include service plus training, consumables, supplies and add-ons, etc.) Service was perceived to be a key influencer of loyalty, but the costs of delivering service were becoming unacceptable to customers. Concurrently, service pricing was coming under increasing competitive pressures.
Similarly, the project team included key members of service, marketing and finance to ensure buy-in. However, at that time it was deemed inappropriate to include representatives from all but two of the countries, owing to travel implications, cost, and resource impacts. In retrospect, this was not a good decision.
● Some wanted a response within a few hours, whereas many others would be equally happy with the next day.
● Some wanted their staff thoroughly trained to take remedial actions supported by a specialist on the phone, while others did not want to know and would just wait for the service provider to fix the problem.


Because of this, the quantitative study included correlating the key drivers of satisfaction and loyalty within each market segment. The qualitative study identified some 28 key customer requirements of their service provider. The quantitative study prioritized these to provide a shorter list of 17 common requirements. The correlation exercise reduced this to only two requirements that drew a significant correlation between satisfaction and loyalty:
1) providing service levels that meet your needs; and

The quantitative study provided detailed ranking of the DBCs and CSFs for each market segment. These were to prove invaluable during the phase of designing the service products and developing the strategy to achieve competitive advantage.
A sampling of internal GlobalTech databases showed that there were sufficient relevant data to achieve better than 70 per cent accuracy, using statistical imputation methods, to code each customer record with its market segment. This was considered to be good enough to enhance marketing communications measurably, but might not be sufficiently accurate to ensure always making the most appropriate offer. Statistical analysis identified four questions that would provide acceptable accuracy in segment identification. These questions could then be used during both inbound and outbound call centre conversations until such time as all customers had been coded. The recommendation was to use both methods in parallel so that accuracy would improve over time. Also, the coding of larger customers should be given a priority.
A facilitator took the team systematically through each piece of relevant information available. Using brainstorming, the team tried to identify every conceivable opportunity, threat or internal issue associated with each item of information. The information was also then tested against a predetermined list of business behaviours and processes in an endeavour to entice additional and creative ideas out of the brainstorming. Using the DBCs and CSFs from the market model, strengths and weaknesses were added, thus turning the process into a SWOT. Like ideas were merged and de-duplicated.
Each idea was given two scores in the range of 1–9. The first ranked the probable financial impact; the second ranked the probability of success. The ideas were then grouped by like activity and where they had the same or an overlapping financial impact. This ensured that double-counting was eliminated, and that opportunities and threats were offset as appropriate. Any one group of ideas would take on the highest single financial impact score and a reassessed probability-of-success score. If the resolution of an internal issue was a prerequisite for capturing an opportunity or overcoming a threat, then the issue plus associated costs and resources was included in the same group as the opportunity or threat. The norm was for a single issue to be attached to many groups. The groups were named and then ranked by both financial impact and probability of success. This provided a prioritized shortlist of imperatives that should deliver the maximum realizable benefits to both GlobalTech and its customers. Iterative discussions developed this into an overall strategy with a number of prioritized sub-strategies. Each sub-strategy was supported by a documented description of the opportunity. At this stage, encouragement was given to creating innovative, yet simple, implementation options that would maximize the chances of success. Each implementation option was supported by market, revenue and organizational impact data, associated issues, resources, costs, and required control metrics. Board members were involved in an option selections and investment approvals process. Finally, the implementation programmes and project plans were created.
A key to the implementation of the project was a recommended change to the customer satisfaction metrics, so that they became an effective diagnostic tool for tuning the ongoing deliverables for each market segment.
The majority of these internal barriers were eventually overcome. Inevitably, there were compromises. These led the project team into believing that not all the market segments would be fully satisfied with the new offerings in all countries.

1 Sell existing products/services to existing segments.
2 Sell existing products/services to new segments.
3 Develop new products/services to sell to existing segments.
4 Develop new products/services to sell to new segments.


Apply the acid test: if my organization no longer existed, would the segment still be there? If so, then this is a true segment. The first template captures the profile for each segment, as illustrated in Table 6.4 for two segments in the financial services investment products market.


● Behaviour and attitudes can produce different outcomes in terms of segmenting customers.
Stage 1 – defining the market
The first step in market segmentation establishes the scope of the segmentation project by specifying the geographic area covered by the project and by clearly understanding from a customer’s perspective the market in which your products or services are competing with those of your competitors. Where necessary, the scope is modified to take into account the realistic capabilities of your organization.
A clear geographic boundary enables you to size the market, to identify the localities in which the dynamics of the market have to be understood and, once the segments have been identified, to develop the appropriate marketing objectives and strategies for those localities.
Keeping the project within the borders of a single country is a manageable starting point because the stage of market development, the available routes to market and the pattern of marketing activity will probably be the same throughout the country. Even this, however, may be too broad for some companies, simply because their geographic reach is limited by physical and/or economic considerations, or even because their appeal has a strong local sentiment attached to it.
For companies trading in numerous countries around the world, there is clearly an enormous attraction in finding a single global segmentation model that can be applied to every country. However, the experience of ‘globalization’ has highlighted for many of these companies that they have to ‘act locally’ in order to succeed in their market. This doesn’t mean that every country is completely unique in respect of the segments found within it. For the international company, a useful guide to predetermining which countries can be included in a single segmentation project is to ensure that in each of these countries the stage of market development, the available routes to market and the pattern of marketing activity are the same, or at least very similar.
All that said, there are some truly global markets emerging due to the prevalence of certain internet platforms: Apple and Google have created global marketplaces for online applications, streaming video services (Netflix, Amazon) are rapidly becoming global standards, computer operator systems, digital SLR cameras, online services (Flickr, Facebook, Twitter, etc) are forcing us to rethink the global-local dynamic.
As a reminder, the general rule for market definition is that it should be described in a way that covers the aggregation of all the alternative products or services that customers regard as being capable of satisfying that same need.
Table 6.2 is an example from financial services:

Market mapping
A useful way of identifying where decisions are made about competing products and services and, therefore, those who then proceed to the next stages of segmentation is to start by drawing a market map. A market map defines the distribution and value added chain between final users and suppliers of the products or services included within the scope of your segmentation project. This should take into account the various buying mechanisms found in your market, including the part played by influencers. An example of a generic market map is given in Figure 6.12.

It is useful to start your market map by plotting the various stages that occur along the distribution and value added chain between the final users and all the suppliers of products or services competing with each other in the defined market. At the same time, indicate the particular routes to market the products are sourced through, as not all of them will necessarily involve all of these stages.

Note at each junction on your market map, if applicable, all the different types of companies/customers that are found there, as illustrated in Figure 6.13.
It is useful at this point to split the volume or value quantity dealt with by each junction between the junction types. This is shown in Figure 6.14. The easiest junction at which to start this stage of market mapping is at the final users’ junction, noting at each junction with leverage the volume/value (or percentage of the total market) that is decided there. Estimate these figures if they are not known and note this as a requirement for any follow-up work generated by this first pass at segmenting your market. This is also illustrated in Figure 6.14, where we see a market in which 30 per cent of annual sales are decided at junctions other than the final user junction.

So far, we have built a market map by tracking the distribution and value added chain found between final users and suppliers, and shown the various routes that are taken through the map to link the two together. We then quantified the map. This was followed by expanding the detail to show the different types of companies/ customers found at each junction on the map, and these were also quantified.
Stage 2 – who specifies what, where, when and how
In this step we are developing a representative sample of different decision makers that identifies the characteristics and properties of a purchase on which decisions are made along with the customer attributes that will be used to describe the decision makers. Each constituent of this sample is called a micro-segment.
The uniqueness of a micro-segment is that, when determining which of the alternative offers is to be bought, the decision makers it represents demonstrate a similar level of interest in a specific set of features, with the features being the characteristics and properties of what is bought, where it is bought, when it is bought and how it is bought as appropriate to the micro-segment. To this are added the descriptors that describe who the micro-segment represents, along with an estimate of the volume or value they account for in the defined market.
The principle behind this step is that, by observing the purchase behaviour of decision makers and understanding the key constituents of this behaviour, we have a platform for developing a detailed understanding of their motivations. It is, therefore, a critical link with the next step of the segmentation process, which looks at why decision makers select the particular products and services they specify. This, in turn, becomes the basis on which the segments are formed.
The process chart in Figure 6.15 shows a number of steps that will now be described. From this, you will see that the process begins with market mapping, which corresponds to a deep understanding of the market. This has already been discussed above.


We can now turn to the process again, and move to steps 2, 3, 4 and 5, although it must be pointed out that segmentation can and should be carried out at all major junctions on the market map, not just at the final user junction.
Essentially, these time-consuming steps involve listing all purchase combinations that take place in the market, including different applications for the product or service (see Figure 6.16), principal forms such as size, colour, branded, unbranded, etc, the principal channels used, when (such as once a year, weekly) and how (such as cash or credit). Next it’s important to describe who behaves in each particular way, using relevant descriptors such as demographics. For industrial purchases this might be standard industrial classifications, size of firm, whereas for consumer purchases this might be socio-economic groups, such as A, B, C1, C2, D and E, or
stage in the life cycle, or age, sex, geography, lifestyles or psychographics. Finally, and most difficult of all, each purchase combination has to have a brief explanation of the reason for this particular type of behaviour. In other words, we need to list the benefits sought, and it is often at this stage that an organization needs to pause and either commission market research or refer to its extant database of previous market research studies. Although in Figure 6.16 there are only 10 micro-segments, it is normal in most markets for companies to identify 30 or so micro-segments. Remember, these micro-segments are actual purchase combinations that take place in a market.
stage in the life cycle, or age, sex, geography, lifestyles or psychographics. Finally, and most difficult of all, each purchase combination has to have a brief explanation of the reason for this particular type of behaviour. In other words, we need to list the benefits sought, and it is often at this stage that an organization needs to pause and either commission market research or refer to its extant database of previous market research studies. Although in Figure 6.16 there are only 10 micro-segments, it is normal in most markets for companies to identify 30 or so micro-segments. Remember, these micro-segments are actual purchase combinations that take place in a market.

To summarize so far, it is clear that no market is totally homogeneous (see Figure 6.17). The reality is that actual markets consist of a large number of different purchase combinations (see Figure 6.18). However, as it is impracticable to deal with more than between 7 and 10 market segments, a process has to be found to bring together or cluster all those micro-segments that share similar or approximately similar needs (see Figure 6.19).

Once the basic work has been done in describing micro-segments, that is steps 2, 3, 4 and 5, cluster analysis will generate a smaller number of segments. The final step consists of checking whether the resulting segments are big enough to justify separate treatment, whether they are indeed sufficiently different from other segments, and whether they have been described sufficiently well to enable the customers in them to be reached by means of the organization’s communication methods; the company then has to be prepared to make the necessary changes to meet the needs of the identified segments.

Before the process of market segmentation can be summarized, it will by now be clear that market segmentation is fundamental to corporate strategy. It is also clear that, since market segmentation affects every single corporate activity, it should not be just an exercise that takes place within the marketing department, but has to involve other functions. Finally, the most senior levels of management must lead this initiative if their organization is to be truly market or customer need driven.

Table 6.3 is a summary of what we have discussed so far. Once market segmentation has been carried out, positioning products and services to meet the different needs of the different segments is comparatively straightforward, but not easy. The most intellectually challenging task is segmenting markets. It is also vital to focus on serving the needs of the identified segments, while it is dangerous to straddle different segments with the same offer. The photocopier example was only one example of thousands of well-known companies that suffered from this mistake as markets began to break into segments. The computer industry during the 1980s and 1990s was also replete with examples of this mistake.
The process of market segmentation itself consists of five steps: One, understand how your market works. This involves defining the market and drawing a market map. Two, list what is bought, including where, when, how, and the different applications of the product or service. Three, list who buys, using descriptors such as demographics and psychographics. Four, list why they buy, especially the benefits sought. Five, search for groups with similar needs. These will be the final market segments.
Market structure and market segmentation are the heart and soul of marketing. Unless an organization spends time on it, driven from the board downwards, it is virtually impossible for it to be market driven, and in any organization that isn’t market driven the marketing function will be ineffective or, at best, will spend its time trying to promote and sell products or services that are inappropriate for the market. Figure 6.20 describes in more detail each of the important steps in the market segmentation process:
● share measurement;
● growth measurement;
● the specification of target customers;
● the recognition of relevant competitors;
● the formulation of marketing objectives and strategies.
● growth measurement;
● the specification of target customers;
● the recognition of relevant competitors;
● the formulation of marketing objectives and strategies.
To summarize, the objectives of market segmentation are:
● to help determine marketing direction through the analysis and understanding of trends and buyer behaviour;
● to help determine realistic and obtainable marketing and sales objectives;
● to help improve decision making by forcing managers to consider in depth the options ahead.
● to help determine marketing direction through the analysis and understanding of trends and buyer behaviour;
● to help determine realistic and obtainable marketing and sales objectives;
● to help improve decision making by forcing managers to consider in depth the options ahead.

Case study
This case study describes the use of market segmentation to assist in the development of a service product. Customer requirements were captured via qualitative research. The segmentation was completed through the use of quantitative research. The result was a set of segments that enabled the development of a new approach to delivering service while improving customer satisfaction. GlobalTech is the fictitious name of a real company marketing high-tech and service products globally. Customers are counted in hundreds of thousands. The markets are mainly business-to-business, with a very few large customers buying thousands of items. Service is a major revenue stream measured in billions of dollars. The lessons learnt could be of interest to any organization having to care for a large number of customers.
Background
A failed segmentation
An internal GlobalTech team tried to complete a marketing audit early in 2000. This included
market definition, market segmentation and quantification. The product divisions conducted
their audits separately. They used mainly brainstorming techniques to define their markets
and produce the data required.
"Markets transcend your internally defined product divisions. Therefore it is best to understand the markets and monitor your overall performance in those markets. To reshape market information to meet the needs of internal reporting will lead to misinformation."
On completion, the results were compared across the divisions. It rapidly became apparent that each division addressed almost all the markets. However, the market definitions they produced were different, with significant bias towards just the products they offered.
Similarly, the segments each division identified were in conflict with the outputs from the other divisions. On reflection, it was agreed that the results were unreliable. They could not be used to help shape future strategies or marketing investments. GlobalTech was now in the uncomfortable situation of being in a market information vacuum. Any confidence it had had in its understanding of the market had been destroyed. Consequently, the decision was taken that all future market analysis and understanding tasks would be supported by appropriate investments in market research.
First market segmentation
The following year the segmentation was redone, supported by extensive qualitative and quantitative market research. The objective was to understand and group into segments the product buyers in the overall market.
The qualitative study produced a very clear picture and definition of the markets addressed by GlobalTech. It also provided the customers’ view of the benefits they sought from the products and the differences in their attitudes towards their suppliers. The questionnaire for the quantitative study was based on the results of the qualitative study. The result was seven clearly defined product buyer segments.
This enhanced understanding of the market assisted with hardware and software product marketing but did not address service products or customer satisfaction and loyalty issues.
The internal need
At the dawn of the 21st century, the market life cycle had matured. All but the more sophisticated products were perceived as commodities. Consequently, the opportunities for effective product differentiation had diminished. GlobalTech, in common with its competitors, was finding that customers were becoming increasingly disloyal.
For many years, product churns and upgrades from existing customers had accounted for some 70 per cent of GlobalTech’s product revenues. Service and exhaust revenues almost equalled total product revenues. (Exhaust revenues are those revenues that follow on, almost automatically, from an initial product sale. These would normally include service plus training, consumables, supplies and add-ons, etc.) Service was perceived to be a key influencer of loyalty, but the costs of delivering service were becoming unacceptable to customers. Concurrently, service pricing was coming under increasing competitive pressures.
The challenge was to increase loyalty while achieving a step function improvement in margins. Thus it was decided to invest in a better understanding of the service market as an enabler to delivering cost-effective differentiation and loyalty. This case study covers the project from inception to implementation.
The segmentation project
Buy-in
The GlobalTech main board director responsible for customer service sponsored the project. This was a critical prerequisite, as the outcome would have a significant impact on the organization, its processes and behaviours.
The GlobalTech main board director responsible for customer service sponsored the project. This was a critical prerequisite, as the outcome would have a significant impact on the organization, its processes and behaviours.
Similarly, the project team included key members of service, marketing and finance to ensure buy-in. However, at that time it was deemed inappropriate to include representatives from all but two of the countries, owing to travel implications, cost, and resource impacts. In retrospect, this was not a good decision.
"Try to anticipate the scale of the organizational change that may result from a major segmentation project. Then ensure that the buy-in planned from the start of the project embraces all those who will have a say in the final implementation."
Business objectives
The project team agreed the overall business objectives as:
● to develop strategies for profitable increase in market share and sustainable competitive advantage in the service markets for GlobalTech’s products;
● to develop strategies for profitable increase in market share and sustainable competitive advantage in the service markets for GlobalTech’s products;
● to identify opportunities for new service products and for improving customer satisfaction within the context of a robust customer needs segmentation that can be readily applied in the marketplace;
● to identify the key drivers of loyalty so that GlobalTech may take actions to increase customer loyalty significantly;
● to provide the information required to help develop a new and innovative set of service products designed and tailored to meet differing customer requirements while significantly reducing internal business process costs.
Results from the qualitative study
The output from the qualitative study was a 93-page report documenting the results, in line with the desired research objectives. Some of the more surprising aspects were supported by verbatims. A key output was the polarization of very different attitudes towards service requirements that some buyers had in comparison with others. For example:
● Some wanted a response within a few hours, whereas many others would be equally happy with the next day.
● Some wanted their staff thoroughly trained to take remedial actions supported by a specialist on the phone, while others did not want to know and would just wait for the service provider to fix the problem.
● Some wanted regular proactive communications and being kept up to date, while others wanted to be left alone.
● Some would willingly pay for a premium service, under a regular contract, while others would prefer to take the risk.
● The attitudes of professional buyers, procuring on behalf of user departments, were consistently different from those of the user departments.
Results of the quantitative study
The output from the quantitative study was extensive. Much of the output was detailed demographic data, opportunities information and competitive positioning comparisons. However, the focus was on a fairly extensive executive summary for internal communications
within GlobalTech. What follow are summarized extracts from those outputs.
within GlobalTech. What follow are summarized extracts from those outputs.
The segments
Six market segments were identified as a result of iterative computer clusterings. Initially the clustering routines had identified more segments, but by careful analysis these were reduced to what was decided to be the most manageable level. Some previously very small segments were merged with very similar larger segments.
Polarizations in attitude
The computer clustering generated the segments by grouping customers with similar attitudes and requirements. This resulted in some marked differences in attitude between segments. As illustrated in the list below, the Koalas really did not want to know about being trained and having a go, but the Teddies, Yogis and Polars had an almost opposite attitude:
● Koala Bears: Preserve their assets (however small) and use, say, an extended warranty to give them cover; won’t do anything themselves, but prefer to curl up and wait for someone to come and fix it. Small offices (in small and big companies), 28 per cent of market
● Teddy Bears: Lots of account management and love required from a single preferred supplier; will pay a premium for training and attention. If multisite, will require the supplier to cover these sites effectively (‘Protect me’). Larger companies, 17 per cent of market
● Polar Bears: Like Teddy Bears except colder! Will shop around for the cheapest service supplier, whoever that may be. Full third-party approach. ‘Train me but don’t expect to be paid.’ Will review annually (seriously). If multisite, will require the supplier to cover these sites effectively. Larger companies, 29 per cent of market
● Yogi Bears: ‘Wise’ Teddy or Polar Bears working long hours; will use trained staff to fix if possible. Need skilled product specialist at the end of the phone, not a booking clerk. Want different service levels to match the criticality of the product to their business process.
Large and small companies, 11 per cent of market
Large and small companies, 11 per cent of market
● Grizzly Bears: Trash them! Cheaper to replace than maintain. Besides, they’re so reliable that they are probably obsolete when they break. Expensive items will be fixed on a pay-as-and-when basis – if worth it. Won’t pay for training. Not small companies, 6 per cent of market
● Andropov Big Bears: My business is totally dependent on your products. I know more about your products than you do! You will do as you are told. You will be here now! I will pay for the extra cover but you will...! Not small or very large companies, 9 per cent of market
Satisfaction and loyalty
GlobalTech was measuring customer satisfaction for use both locally, as a business process diagnostic tool, and globally, as a management performance metric. These satisfaction metrics were averaged across all customers, both by geographic business unit and by product division to meet internal management reporting requirements.
GlobalTech was measuring customer satisfaction for use both locally, as a business process diagnostic tool, and globally, as a management performance metric. These satisfaction metrics were averaged across all customers, both by geographic business unit and by product division to meet internal management reporting requirements.
However, the outputs from the quantitative study clearly showed that these traditionally well-accepted metrics were, in fact, almost meaningless. What delighted customers in one market segment would annoy customers in another, and vice versa. To make the metrics meaningful, they had to be split by key criteria and the market segments. Loyalty was obviously highest where GlobalTech’s ‘one size fits all’ service deliverable coincidently best matched the segment’s requirement, as illustrated in Figures 6.21 and 6.22.


Correlation between loyalty and customer satisfaction
The market life cycle for many of GlobalTech’s products was moving into the commodity phase. Therefore, not surprisingly, customers were becoming less loyal. Each percentage point increase in loyalty translated into almost the same increase in market share. Each percentage point in market share added many millions of dollars of gross revenues. The cost of reselling to a loyal customer was about one-sixth the cost of winning a new customer. Consequently, each percentage point increase in loyalty had a significant impact on the bottom line.
Because of this, the quantitative study included correlating the key drivers of satisfaction and loyalty within each market segment. The qualitative study identified some 28 key customer requirements of their service provider. The quantitative study prioritized these to provide a shorter list of 17 common requirements. The correlation exercise reduced this to only two requirements that drew a significant correlation between satisfaction and loyalty:
1) providing service levels that meet your needs; and
2) providing consistent performance over time.
Although GlobalTech was achieving the second, it was delivering the first in only two of the market segments.
Segment attractiveness
As an aid to deciding where best to invest, a chart of segment attractiveness was produced using attractiveness factors determined by GlobalTech (Figure 6.23). Demographic data from the quantitative study were combined with internal GlobalTech financial data. Each factor was weighted to reflect the relative importance to GlobalTech. This highlighted quite a few issues and some opportunities. For instance, the highest margins were coming from some of the least loyal segments.

Competitive positioning
Fortunately for GlobalTech, its competitors did not appear to have an appreciation of the market segments of the differing requirements of their customers. They were also mainly delivering a ‘one size fits all’ service offering. However, there were some noticeable differences in their offerings. These resulted in each major competitor being significantly stronger in just one or two market segments where their deliverable best matched the segment needs.
The quantitative study provided detailed ranking of the DBCs and CSFs for each market segment. These were to prove invaluable during the phase of designing the service products and developing the strategy to achieve competitive advantage.
"Decision buying criteria (DBCs) are the needs (benefits) buyers are seeking to have satisfied by their choice of product or service. Critical success factors (CSFs) are the constituents of the factors required to deliver each DBC."
Reachability
Key to GlobalTech successfully implementing any strategies or communications that were to be market segment based would be being able to identify each customer by segment. As part of the quantitative study, two statistical reachability tasks were completed.
A sampling of internal GlobalTech databases showed that there were sufficient relevant data to achieve better than 70 per cent accuracy, using statistical imputation methods, to code each customer record with its market segment. This was considered to be good enough to enhance marketing communications measurably, but might not be sufficiently accurate to ensure always making the most appropriate offer. Statistical analysis identified four questions that would provide acceptable accuracy in segment identification. These questions could then be used during both inbound and outbound call centre conversations until such time as all customers had been coded. The recommendation was to use both methods in parallel so that accuracy would improve over time. Also, the coding of larger customers should be given a priority.
"Understanding the different market segments helps in designing the required offers, but do not get too concerned about reachability. It is not essential to code every customer to the right segment from day one. Where you are not really sure, let them see different offers and so position themselves. Similarly, be willing to accept that within a large organization some buyers may fall into different market segments, though the difference will be on only one or perhaps two buying criteria rather than across all the buying criteria."
Strategy development and implementation
Market understanding and strategy development
The challenge now was for the project team to absorb and understand all the findings from the two research studies. The team then had to turn that understanding into realizable strategies. To achieve this, a workshop process covering opportunities, threats and issues (OTIs) was used. Briefly, the process involved an extensive, but controlled, brainstorming session followed by a series of innovative strategy development workshops.
A facilitator took the team systematically through each piece of relevant information available. Using brainstorming, the team tried to identify every conceivable opportunity, threat or internal issue associated with each item of information. The information was also then tested against a predetermined list of business behaviours and processes in an endeavour to entice additional and creative ideas out of the brainstorming. Using the DBCs and CSFs from the market model, strengths and weaknesses were added, thus turning the process into a SWOT. Like ideas were merged and de-duplicated.
Each idea was given two scores in the range of 1–9. The first ranked the probable financial impact; the second ranked the probability of success. The ideas were then grouped by like activity and where they had the same or an overlapping financial impact. This ensured that double-counting was eliminated, and that opportunities and threats were offset as appropriate. Any one group of ideas would take on the highest single financial impact score and a reassessed probability-of-success score. If the resolution of an internal issue was a prerequisite for capturing an opportunity or overcoming a threat, then the issue plus associated costs and resources was included in the same group as the opportunity or threat. The norm was for a single issue to be attached to many groups. The groups were named and then ranked by both financial impact and probability of success. This provided a prioritized shortlist of imperatives that should deliver the maximum realizable benefits to both GlobalTech and its customers. Iterative discussions developed this into an overall strategy with a number of prioritized sub-strategies. Each sub-strategy was supported by a documented description of the opportunity. At this stage, encouragement was given to creating innovative, yet simple, implementation options that would maximize the chances of success. Each implementation option was supported by market, revenue and organizational impact data, associated issues, resources, costs, and required control metrics. Board members were involved in an option selections and investment approvals process. Finally, the implementation programmes and project plans were created.
The strategy
The overall recommendation was to create a set of service deliverables tailored to the individual needs of each segment. These would be complemented by a set of premium add-ons that could be offered to the appropriate segments. By focusing on business process simplification during the design of the offering for each segment, redundancy was eliminated.
The objective of each offering was to increase customer satisfaction significantly, with an emphasis on those items that would most positively impact on loyalty. Some offerings were quite different from others, in terms both of the deliverable and of the internal processes that made it possible. This differentiation was also intended to create a measurable competitive advantage in a number of market segments.
A key to the implementation of the project was a recommended change to the customer satisfaction metrics, so that they became an effective diagnostic tool for tuning the ongoing deliverables for each market segment.
Implementation
Throughout the project, the same core team had been intimately involved with each stage of the project. They guided the work and took on board the results. They delved deeply into the analysis and did their best to understand the markets, their customer requirements and likely competitive impacts. Finally, they worked hard at developing the proposed strategies. They thought buy-in had been achieved by the project being sponsored by a main board director.
The implementation roll-out across country boundaries became difficult. Each country wanted its say. Each country had different views of its customer needs and how things should be done in the country. The countries did not easily understand or even accept the findings of the research and the meaning of the outputs.
The majority of these internal barriers were eventually overcome. Inevitably, there were compromises. These led the project team into believing that not all the market segments would be fully satisfied with the new offerings in all countries.
Segmentation and the Metrics model
The purpose of this section is to describe briefly how the necessary segmentation data should be captured in the Metrics model. The stage in the overall model process is shown in Figure 6.24.

The Ansoff Matrix
The Ansoff Matrix (Ansoff, 1957) also provides a useful framework for identifying the products/services that might be most appropriate for each selected segment (Figure 6.25). This is a two-dimensional matrix mapping what is sold (products/ services) and to whom (segments), divided into four possible strategies:
1 Sell existing products/services to existing segments.
2 Sell existing products/services to new segments.
3 Develop new products/services to sell to existing segments.
4 Develop new products/services to sell to new segments.

‘Existing’ segments can also be interpreted as those segments in a market that the company is already serving, while ‘new’ segments can also mean segments existing in a market that the company has not served in the past.
Applying the Metrics model
As shown in Figure 6.25, some strategies will be about increasing penetration within an existing segment, whereas others might be about entering new markets, requiring the company to diversify beyond its historical ‘comfort zone’ and take a higher risk.
The data that need to be captured for each selected market segment have two main components (Figure 6.26): 1) data that describe the type of people or organizations within the segment (what they are like, their aspirations, behaviour and attitudes, what their needs and wants are, etc); and 2) what the organization’s aspiration is within that segment. In addition there is the need to identify the key metrics that will measure the current situation and the changes over time, and how the measuring will be undertaken – the sources of the data and who is responsible for the measurement process.

Remember to ensure that the golden rule of segmentation is kept in mind – a segment exists independently of the organizations providing it with products and services.
Apply the acid test: if my organization no longer existed, would the segment still be there? If so, then this is a true segment. The first template captures the profile for each segment, as illustrated in Table 6.4 for two segments in the financial services investment products market.
In the next template, Table 6.5, the metrics and sources of the metrics are captured for each key factor for the segment. In the example shown, there are two needs/ wants of those in the affluent greys segment, plus two attributes. The final template, Table 6.6, captures what the organization (‘us’) is hoping to achieve by marketing to a particular segment, and how the performance compares with that of our key competitors.


Segmentation ground rules
Members of the Measurement and Marketing Accountability Forum at Cranfield University identified a set of ground rules that they considered assisted the development of a segmentation strategy. These were divided into two parts: firstly, those that will help gain commitment to the concept of segmentation; secondly, points that will help the development and implementation process.
Gaining and maintaining commitment
● Gaining the commitment of top management is crucial, for example to provide reasons why a seemingly profitable business opportunity is not being pursued.
● Ensure that those expected to work with the segmentation fully understand what it is and what implementation entails.
● Does it match existing business rules, or will new ones be needed?
● Ensure that the implications for resources are fully considered.
● Start with a simple model, perhaps based on estimated data, to gain experience and commitment.
● Cost and revenue profiles can provide a starting point in gaining commitment to the principles.
● Don’t underestimate the feasibility, or how long the process might take.
● Manage expectations, especially the payback period.
● Developing personality profiles for the segments helps bring them alive and helps the communication of the key differences.
Development and implementation
● Ensure there is a clear rationale and objectives (that are SMART1).
● Different segmentation models may be needed to achieve different goals.
● Use can dictate methodology/criteria. For example, segmenting the market with an emphasis on billing requirements may be different from a segmentation aimed at identifying the best new prospective customers.
● Different segmentation models may be needed to achieve different goals.
● Use can dictate methodology/criteria. For example, segmenting the market with an emphasis on billing requirements may be different from a segmentation aimed at identifying the best new prospective customers.
● Behaviour and attitudes can produce different outcomes in terms of segmenting customers.
● Take into account the maturity of the overall market.
● Strategies based on a segmentation may lead to future behaviour that moves customers from one segment to another.
● The ability to deal with complexity may lead to competitive advantage.
● Ensure that the segmentation strategy doesn’t create conflict with other, high-performing strategies.
● Data availability is a vital consideration.
● Ensure that the organization has the flexibility to face the market in a different way from that of pre-segmentation.


COMMENTS