


Key to finalizing the process is to decide those metrics that will be included and those that won’t and, also, who will see the different m...
Key to finalizing the process is to decide those metrics that will be included and those that won’t and, also, who will see the different metrics in the final list in order to develop subsets for different levels of management within the organization and for different functions and teams. The stage in the overall Metrics model process is shown in Figure 9.1.

● Is the team developing the metrics strategy sufficiently representative and empowered to ensure that the outcomes will be actioned?
● Does the process have a senior management sponsor and support at
board level?
● Which corporate goals could be influenced by marketing strategy?
● Is the definition of marketing used by the organization sufficiently broad to include all points of contact with consumers?
● Is there a detailed segmentation of the market (not just the organization’s customers – the acid test here is that the segments would still exist even if your company was no longer in existence), and have the key segments of consumers been identified that the organization is most interested in within future strategy?
● Does the segmentation analysis include profiles of the relevant consumers, and has it identified their detailed needs?
● Are the company’s aspirations or goals for each segment clearly defined?
● Are there strategies in place to deliver these aspirations?
● Has the company identified the baselines necessary for successfully operating in each segment (qualifying factors)?

● ‘Things we are implementing’: these are metrics that are already in place or being developed. These mainly consisted of the measures that were being used to track the performance of the business – primarily derived from market research, customer satisfaction, internal financial measures and industry data.
● ‘What we know we want to have’: these are metrics identified in the model process considered essential to monitoring key strategies and market changes that were not currently being collected. For example, while a company may monitor the market overall, the data are not collected at segment level. The necessary metrics would be developed as part of the strategy implementation process.
● ‘What we don’t do but probably should’: these were metrics that, while helpful, were after detailed consideration not considered essential or worth investing resources in for the time being. Reviewing the need for these would be included as an action at appropriate stages in the future plans.
● ‘What we don’t know and probably won’t’: the final category covered metrics that would be either very difficult or relatively expensive to collect in terms of the value derived from undertaking the measurement. These would be the subject of further investigation, or a business case.
● segment metrics;
● impact factors;
● actions.

● How will it be measured, and what is the source? For example, it could be any specific market research survey, internal management information system, etc.

Developing metrics that matter
In compiling the final list of metrics, it is vitally important to ensure they are ‘fit for purpose’. The following is a checklist of points to consider in order to develop a metrics strategy that provides reliable information for management decision making:
● Beware of spurious correlations: correlation is not the same as causation. As Binet and Field (2007) point out, correlations between brand performance and exposure to a campaign are often used as measures, but other factors may be disguising the true picture, such as seasonality.
● There is no single measure: the trend, especially for board-level data, is to reduce the number of key measures to the absolute minimum. However, there is no single ‘golden’ metric that on its own provides a sufficient understanding of the impact of marketing on achieving corporate goals. Each objective needs its own measure or measures.
● Don’t focus on intermediary measures: the impact of marketing is too often measured through changes in ‘awareness’, ‘beliefs’, attitudes’, ‘intentions’, etc. These are called ‘intermediary objectives’, as they do not tell you whether or not changes at this level have influenced actual purchasing, or retention behaviour. However, the real objective of marketing is to change people’s behaviour, and therefore metrics should focus on measuring the extent to which this has actually happened. Positively influencing the intermediary measures may be a key objective of marketing activity, but if successful it should lead to action, and that is what should be at the heart of the metrics strategy.
● Be market focused: market share is a key metric in measuring the performance of marketing. However, market share within each segment is far more useful than simple share within the overall market, as this does not help assess whether the defined strategy is influencing behaviour by the groups of consumers the organization is targeting. Focusing on market share also means that the organization is taking into account trends in the market and the performance and actions of competitors. The InterTech example shown earlier illustrates the need to focus on the position of the organization within the market rather than simply focusing on internal measures of performance such as sales and spend.
● Apply the tools: as mentioned earlier, econometrics provides a useful methodology for identifying the contribution of each element in the marketing mix. There are also methods for helping to identify groups of customers that are potentially at risk from the predations of competitors, or those of their customers that might be interested in a new supplier (eg the Conversion Model – Hofmeyr, 1990).
● Market position versus market growth: some marketing expenditure is simply to retain current market position, while other expenditure is to grow market share. It is important to try to distinguish between the two and ensure that the metrics used enable this to be achieved.
● Be comprehensive: by using a tool such as the value chain described earlier, all the areas that can have an impact on delivering the promise made by marketing to consumers can be identified. From this analysis, a comprehensive, pan-organization set of key metrics can be developed.
● Be comprehensive: by using a tool such as the value chain described earlier, all the areas that can have an impact on delivering the promise made by marketing to consumers can be identified. From this analysis, a comprehensive, pan-organization set of key metrics can be developed.
Auditing for success
In addition to providing a method to identify the strategy, actions and metrics for each key market segment, the model also provides a useful audit process, or checklist, for organizations to ensure all the key issues have been identified and covered in developing an appropriate strategy and associated measures. A summary of the main points that should be covered is shown below. All of these points are covered in detail previously:
● Is the team developing the metrics strategy sufficiently representative and empowered to ensure that the outcomes will be actioned?
● Does the process have a senior management sponsor and support at
board level?
● Which corporate goals could be influenced by marketing strategy?
● Is the definition of marketing used by the organization sufficiently broad to include all points of contact with consumers?
● Is there a detailed segmentation of the market (not just the organization’s customers – the acid test here is that the segments would still exist even if your company was no longer in existence), and have the key segments of consumers been identified that the organization is most interested in within future strategy?
● Does the segmentation analysis include profiles of the relevant consumers, and has it identified their detailed needs?
● Are the company’s aspirations or goals for each segment clearly defined?
● Are there strategies in place to deliver these aspirations?
● Has the company identified the baselines necessary for successfully operating in each segment (qualifying factors)?
● Does the company know what consumers expect from a market leader provider in each segment (competitive advantage factors)?
● Has the company identified how to meet market needs as efficiently as possible (productivity factors)?
● Has the company identified how to meet market needs as efficiently as possible (productivity factors)?
● Have all the necessary actions been identified in order to deliver the strategy for each segment?
● Have all the necessary teams been fully involved in developing the actions, and are they included in their plans?
● Have the resources – internal and external – needed to deliver these actions been assessed and costed?
● Can the impact of the actions on market performance be assessed?
● Have all the necessary metrics been identified at each stage of the process?
● Does the final list of metrics identify who will see each metric and who is responsible for taking any necessary corrective action?
Bringing it all together
The core sets of metrics, and how they link together to enable the final set to be identified and agreed, are diagrammatically represented in Figure 9.2. The objective is to bring together the sets of metrics identified in the previous stages of the model, covering:
● corporate goals (Workshop 1);
● market segments (Workshop 1);
● impact factors (Workshop 2);
● actions and budgets (Workshop 3).
● market segments (Workshop 1);
● impact factors (Workshop 2);
● actions and budgets (Workshop 3).

However, before the appropriate template can be completed, there needs to be a reality check conducted on the full lists derived in the earlier stages of the analysis process. This is necessary, as the overall strategy will probably need to be phased in over time. In addition, some of the data, or metrics, might be readily available, whereas in other cases a plan to collect data and derive the metrics will be needed, for example where a new activity is part of the strategy. In some cases, it may prove very difficult to collect the data, or the level of investment required may be deemed unacceptable relative to the benefit. The information supply chain described in earlier and illustrated in Figure 8.4 can also be used to help decide whether it was worth investing in collecting data to provide a particular measure. Discussing the implications of the modern data rich world could fill at least another book. In addition to traditional sources (primary research – survey, operational data, retailer data), customers generate data online directly through your online channels and through social media. At the time of writing this book, we are at the cusp of large-scale location tracking through smart phones. One benefit from the Metric model process is that, by identifying all the necessary metrics needed to track performance over time, a more strategic approach to analytical data is enabled; rather than just gathering more and more ‘because it is there’, ‘big data’ will cost big money and intuitively, it is appealing to guide such investments with knowledge of which data really matters.
One organization used the following framework to categorize the full list of metrics:
● ‘Things we are implementing’: these are metrics that are already in place or being developed. These mainly consisted of the measures that were being used to track the performance of the business – primarily derived from market research, customer satisfaction, internal financial measures and industry data.
● ‘What we know we want to have’: these are metrics identified in the model process considered essential to monitoring key strategies and market changes that were not currently being collected. For example, while a company may monitor the market overall, the data are not collected at segment level. The necessary metrics would be developed as part of the strategy implementation process.
● ‘What we don’t do but probably should’: these were metrics that, while helpful, were after detailed consideration not considered essential or worth investing resources in for the time being. Reviewing the need for these would be included as an action at appropriate stages in the future plans.
● ‘What we don’t know and probably won’t’: the final category covered metrics that would be either very difficult or relatively expensive to collect in terms of the value derived from undertaking the measurement. These would be the subject of further investigation, or a business case.
An alternative format used with another organization was a four-box matrix, as shown in Figure 9.3. This plots the value, or importance to the overall strategy, of implementing a metric by the level of difficulty in collecting the necessary data to generate the metric.
In the examples shown, creating consumer profiles for each segment has a high value, and would be easy to achieve – simply undertaking a cluster analysis of the results from a monthly market research survey using data already collected in the questionnaire. Also, in working through the Metrics model, measuring the impact of the overall marketing strategy on either customer or brand equity was judged an important measurement. However, measuring the impact on customer equity seems to be easier to implement than for brand equity and therefore is probably the measure to implement. In comparison, collecting the sales of a key competitor on a monthly basis is difficult, and not of major value. Maybe it would be easier to collect the data at less frequent intervals, perhaps only annually. Finally, although it will be fairly difficult to measure the impact of developing a website on customer retention, its importance suggests that this will need to be addressed in the metrics strategy.
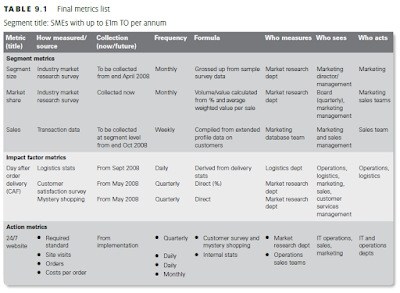
Plotting all the proposed metrics in this way will help prioritize the metrics strategy. The final, and key, template is shown in Table 9.1. This summarizes the agreed list of metrics for each segment, covering:
● segment metrics;
● impact factors;
● actions.


For each metric, the key questions that need answers are as follows:
● How will it be measured, and what is the source? For example, it could be any specific market research survey, internal management information system, etc.
● Are the data that provide the metric collected now, or will they be collected in the future? If they are to be collected in the future, when will measurement commence?
● When, and how frequently, will the measure be made? For example, market share and segment profiles might be measured from a quarterly survey of consumers; average time to calls being answered from call centre data; or customer satisfaction from a monthly survey.
● Is the metric to be a raw measure, or will it be derived or modelled from one or more data-sets? Econometrics-based models might be used to help identify the most appropriate mix of advertising channels to use; index scores might be calculated from customer satisfaction survey data; customer equity might be constantly recalculated depending on the product mix used by customers; and market share might simply be the answer to a brand usage question in
a survey of consumers.
● Who is responsible for collecting or deriving the measure? Establishing responsibility is vital – does this lie within the marketing team or other areas of the business, and has this responsibility been agreed?
● Who sees the metrics? It is important to identify who within the organization sees each agreed metric, and in what form. For example, is it an input to a balanced scorecard or board-level dashboard, or is it used only by the marketing team to measure a particular activity, such as an advertising campaign? While marketing may use a suite of metrics to measure the effectiveness of advertising and promotional campaigns, the board may see only a quarterly report on market share.
● Who is responsible for taking action? It is also vital to identify who has responsibility for taking action if the metric shows that one or more targets set for the strategy are not being achieved.
The example shown in Table 9.1 shows three metrics for monitoring the changes at segment level: the overall size of the segment, the market share of the company and main competitors, and sales volumes. Market share is the one shown that is reported at board level (quarterly).
One impact factor example is shown – next-day delivery, identified as a competitive advantage factor for this segment. This shows that responsibility for corrective action lies outside the marketing team, whereas the measurement process is split between the internal logistics team (delivery statistics) and externally conducted market research (customers’ view of the service) commissioned by the market research department. This is because, while the logistics team measures orders leaving the warehouse, it does not measure the performance of the third-party delivery company from a customer perspective.
Finally, one key action is shown – introducing website ordering to support the next-day delivery service. Again, this is split in terms of who measures and who needs to take corrective action.
This final list should be used as the master list, feeding into other existing management information reports, such as balanced scorecards, as mentioned above. Key to finalizing the metrics strategy is the need to define those who should be exposed at board level – this is a key reason why the Metrics model process needs a senior manager as sponsor, preferably at board level.
Obviously, this will always be an iterative process, as the strategies and actions defined at any given moment in time will need to be updated to ensure continuing competitiveness in terms of market needs and actions of competitors, and to remain in tune with changing company priorities.


COMMENTS